Quantcast
Channel: Buttons — DataTables forums
Viewing all 478 articles
Browse latest View live

DataTables warning: table id=data-table-simple - Requested unknown

$
0
0


I only need to know how to avoid this alert or destroy it. This happens when I create a new row with the create button.

var editor = new $.fn.dataTable.Editor( {
    table: "#data-table-simple",
    fields: [ {
            label: "Vendedor:",
            name: "Vendedor"
        }
      ]
    });
$('#data-table-simple').DataTable( {
      select: 'single',
      dom: "Bfrtip",
      columns: [
          { data: "Vendedor" },
          { data: "Ver" },
          { data: "Eliminar" },
          { data: "Activar o desactivar" }
      ],
      order: [
        [ 0, "asc" ]
      ],
      buttons: [
          { extend: "create",
            editor: editor,
            text: "Crear"
           },
          { extend: "edit",
            editor: editor,
            text: "Editar"
           }
      ]
    });

Excel export and comma decimal

$
0
0

We are using commas for decimal. If we export numbers with commas, for example 1,59 the number exports as 159.

The example works but it also format columns with strings. How can we format only columns with numbers?

{
            extend: 'excel',
            exportOptions: {
                columns: ':visible',
                format: {
                    body: function(data, row, column, node) {
                        return data.replace(',', '.');
                    }

                }
            }
        }

Excel/CSV export for long number-like strings (large numbers)

$
0
0

We have had issues with large number-like values in export to Excel. Specifically, we have values which are all digits -- but they are really more a string than a number. When the export happens, these "numbers" are rounded by Excel and the data is changed. For example:
* 8335201430007628 gets changed to 8335201430007630 (rounding on last digit causes last 2 digits to change)
* 8335201430210032 gets changed to 8335201430210030

I modified the source code to handle our case as below. Thoughts?

in button.excelHtml5 action:

   if ( ! cell ) {
      // If number is large, treat it as a string so it won't get rounded by Excel.
      var treatNumberAsText = false;
      if ( row[i].match && $.trim(row[i]).match(/^-?\d{15,30}$/) ) {
         treatNumberAsText = true;
      }

      // Detect numbers...
      if ( !treatNumberAsText && ... ) {
      ...
   }

in buttons.csvHtml5:

DataTable.ext.buttons.csvHtml5 = {
   ...
   extension: '.txt',   // .csv (use .txt extension to force user to process column types on opening in Excel -- this prevents Excel from rounded large strings that look like numbers)
}

Print button only prints current page data.

$
0
0

Hi Team,
I am using latest version of DataTable.
I am facing issue realted to print button. I am calling my data by Ajax url and when I print the record it prints only current list records. Just Like if I am searching something which gives me 15 record and pagination is selected as 10 Rows. SO on print it prints only 10 records.

So how can I make DataTable which prints all record and doesn't go for pagination?

I am using following code.
//---------------------------------------------
processing: true,
serverSide: true,
ajax: {
url: "AJAX URL",
type:"POST"
},
buttons: [
{
extend: 'print',
autoPrint: false,
}
],
//---------------------------------------------

I have tested my code by removing "serverSide: true ". Then It works according to my requirements.
But How can I do it without remove serverside processing.

Thank you in advance

filename: need table id

$
0
0

QUESTION: How could I grab the (this) table id when the PDF button is clicked?
(Everything else is working, except this filename.)

{
                extend: "pdf",
                text: "Save PDF",
                filename: function(){
                    var d = new Date();
                    var n = d.getTime();


                    var tableID = "**_need table ID here_**";
                    return tableID + "_" + n;**


                },
                exportOptions: {
                    stripNewlines: false,
                    columns: [0,1,2,3]
                }
}

What function does the Copy (HTML5) button execute?

$
0
0

I would like to duplicate the function of the Copy button elsewhere in my app. I have tried adding another button like this:
<button type='button' id='btnCopySurrogate' class='c8dataChooserButton'>Copy to Clipboard</button> $('#btnFileChooserSurrogate') .on('click', function () { $('.dt-button.buttons-copy.buttons-html5').trigger('click'); });
but this doesn't seem to work (i.e.there is no confirmation message).
In any case, a cleaner approach would be to define the new button with the actual function that the original Copy button executes, rather than triggering a click on the original.

colvis callback

$
0
0

Hi,

Is there a callback option on colvis?
I would like to send selected columns up to the server with an ajax request.

Thanks! :)

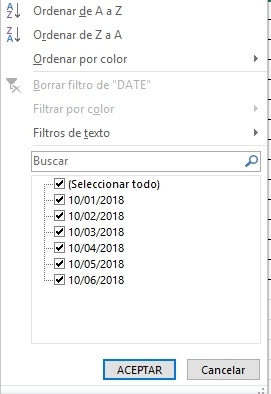
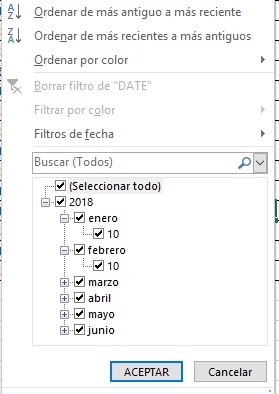
What is the correct format to export dates with html5 to excel?

$
0
0

These are my dates in datatables (dd/mm/yyyy).

Then I export these dates with the excel button.

As you can see the dates are in the left side and excel treats them as a general format.

Then if I double click each row excel treats theam as date format (right side of the column)

and now I can use the date filters correctly

I tried dd/mm/yyyy and yyyy-mm-dd formats and it does not work I always need to double click on each row.
The only thing I need is not to use the double click again each row.


Export values typed in input box (excelHtml5)

$
0
0

Hi,

I've searched and tried getting this fixed for some hours now, but cannot get it to work.

The cell consists of some div's wrapped around an input type text, and I need to only get the typed value from this input exported to excel.

Any help is much appreciated

PDF Export a Table in a Table

$
0
0

I need a PDF export of an datatable that have an table in a cell. I try to do this with the following code:

dtButtons.push( {
                extend: 'pdfHtml5',
                text: '<i class="fas fa-file-pdf text-red fa-fw"></i>',
                customize: function( doc ) {
                    var name = mt_fee.column(1).data().toArray();
                    var sex = mt_fee.column(2).data().toArray();
                    var yob = mt_fee.column(3).data().toArray();
                    var events = mt_fee.column(4).data().toArray();
                    var events_lenght = events.length;
                    var rows = [];
                    var entries = [];
                    var ent = [];
                    
                    for( var i = 0; i < events.length; i++ ) {
                        var subtablerows = ( 0 == events[i].length % 2 ) ? Math.floor( events[i].length / 2 >> 0 ) : Math.floor( events[i].length / 2 >> 0 ) + 1;
                        var row_remainer = events[i].length % 2;
                        var entriesnr = events[i].length;
                        var nr0 = 0;
                        var nr1 = 1;
                        for( var j = 0; j < ( subtablerows - 1 ); j++ ) {
                            if( 'undefined' !== events[i][nr0].distance && 'undefined' !== events[i][nr1].distance ) {
                                entries[j] = [
                                    events[i][nr0].distance + 'm ' + events[i][nr0].stroke + ' (' + events[i][nr0].eventNumber + ')',
                                    events[i][nr0].entrytime,
                                    events[i][nr1].distance + 'm ' + events[i][nr1].stroke + ' (' + events[i][nr1].eventNumber + ')',
                                    events[i][nr1].entrytime
                                ];
                            } else if( 'undefined' !== events[i][nr0].distance && 'undefined' === events[i][nr1].distance ) {
                                entries[j] = [
                                    events[i][nr0].distance + 'm ' + events[i][nr0].stroke + ' (' + events[i][nr0].eventNumber + ')',
                                    events[i][nr0].entrytime,
                                    '',
                                    ''
                                ];
                            }
                            nr0++;
                            nr1++;
                        }
                        //console.log( entries );
                        ent[i] = [ {
                            table: {
                                body: entries
                            }
                        } ];
                        console.log( ent[i] );
                        rows[i] = [ name[i], ( 'FEMALE' == sex[i] ) ? 'F' : 'M', yob[i], [ ent[i] ] ];
                    }
                    console.log(rows);
                    var objMain = {
                        table: {
                            body: [
                                rows
                            ]
                        }
                    };
                    
                    doc.content[1].table.body = rows;
                }

            } );

My problem is, only one table object are include in one cell and it is the wrong one. in the oder cells i see empty tables. I have attached a result file that you can see my problem. Any Idea where my fault ist?

Andreas

active button

$
0
0

I have a problem to activate a button if no row is selected and deactivate if a row is selected.
I tried with this code:

            dtButtons.push( {
                text: '<i class="fas fa-check-double fa-fw"></i>',
                titleAttr: button_txt[3],
                className: 'text-Peru',
                action: function( e, dt, node, config ) {
                    var data = mt_sum.row( { deselected: true } ).data();
                    $.post( {
                        url: 'lib/adm/meet-api.php?mmap=7'
                    } )
                    .done( function( data ) {
                        var notify = ( undefined == data.title ) ? JSON.parse( data ) : data;
                        if( 'done' != notify.type ) {
                            pNotify( notify.title, notify.text, notify.icon, notify.type );
                        }
                        mt_sum.ajax.reload();
                    });
                },
                enabled: true
            } );

        mt_sum.on(
            'select', function () {
                var selectedRows = mt_sum.rows( { selected: true } ).count();
                if( 6 == uLevel || 5 == uLevel ) {
                    mt_sum.button( 3 ).enable( selectedRows === 1 );
                    mt_sum.button( 4 ).enable( selectedRows === 1 );
                } else if ( 4 == uLevel ) {
                    mt_sum.button( 3 ).enable( selectedRows === 1 );
                    mt_sum.button( 4 ).enable( selectedRows === 1 );
                }
            } );

            mt_sum.on(
            'deselect', function() {
                var selectedRows = mt_sum.rows( { selected: true } ).count();
                if( 6 == uLevel || 5 == uLevel ) {
                    mt_sum.button( 3 ).disable( selectedRows === 0 );
                    mt_sum.button( 4 ).disable( selectedRows === 0 );
                } else if( 4 == uLevel ) {
                    mt_sum.button( 3 ).disable( selectedRows === 0 );
                    mt_sum.button( 4 ).disable( selectedRows === 0 );
                }
            } );

Have anyone a hint for me.

Andreas

Print export

$
0
0

I config the print outputs by define css classes.
In the datatable part I define the columns in the columnDefs part.

            columnDefs: [
                { targets: 0, visible: true, className: 'p-5 text-right vertical-align-top entry-nr', width: '3.5%' },
                { targets: 1, visible: true, className: 'p-5 text-left vertical-align-top entry-name', width: '25%' },
                { targets: 2, visible: true, className: 'p-5 text-center vertical-align-top entry-sex', width: '3%' },
                { targets: 3, visible: true, className: 'p-5 text-center vertical-align-top entry-yob', width: '3%' },
                { targets: 4, visible: true, className: 'p-5 text-center entry' },
                { targets: 5, visible: true, className: 'p-5 text-center entry-status' },
                { targets: '_all', visible: false, searchable: false, orderable: false }
            ],

in my button definition I define witch coulmns I need to print.

            dtButtons.push( {
                extend: 'print',
                text: '<i class="fas fa-print fa-fw" style="color:grey"></i>',
                autoPrint: false,
                titleAttr: button_txt[2],
                exportOptions: {
                    columns: [1, 2, 3, 4, 5],
                    orthogonal: 'export'
                },
                customize: function( win ) {
                    $( win.document.body ).find( 'td.entry-name' ).css( 'text-align', 'center' );
                }
            } );

This works, but the content of the print pages did not have the right classes. I have used the developer tool from MS Edge.
This is the output

<tr>
<td class="p-5 text-right vertical-align-top entry-nr">ALMASY Katharina</td>
<td class="p-5 text-left vertical-align-top entry-name" style="text-align: left;">F</td>
<td class="p-5 text-center vertical-align-top entry-sex">2007</td>
<td class="p-5 text-center vertical-align-top entry-yob">100m BIFINS (18)01:30.9250m SURFACE (16)00:39.9350m BIFINS (8)00:39.8325m BIFINS (1)00:17.63100m SURFACE (5)01:28.3725m SURFACE (12)00:18.52</td>
<td class="p-5 text-center entry">A</td>
</tr>

You see that the classes are not correct as define. The first column should be entry-name and not entry-nr. Anyone an idea why this is?

Andreas

Is there a way to disable the fade effect on the buttons extension?

$
0
0

I am using animate.css and animate.delay.css and the animation-fill-mode: both; causes issues the the datatables column visibility fadeIn behavior. Is there any way to disable this? Thanks in advance!

Regression - Buttons HTML5 Excel export no longer works on IE11. Worked up to version 1.4.2

$
0
0

I think we just discovered a regression with the buttons extension, concerning the HTML5 export, specifically on IE11.

I tested every version from 1.1.2 all the way up to 1.5.2, and I can confirm that it worked on IE11 all the way up to 1.4.2. Both 1.5.2 and 1.5.3 cause an error on IE11 preventing the excel file from being opened.

You can easily reproduce this error on the example page for datatables here: https://datatables.net/extensions/buttons/examples/html5/simple.html

If you use IE11, then try to export to excel, the downloaded file will be corrupt and will fail. Roll buttons back to 1.4.2 and it will work correctly again.

Any idea what could cause this regression? I don't see anything in the release notes about this

(FYI, just as an addendum, it would be infinitely useful if there was a centralized place to click through the different versions and read the release notes. A CHANGELOG.md in the github repo with links to the release pages would be very helpful. I had to just alter the URL to step through the versions and read all the release notes. I was basically just altering this URL https://cdn.datatables.net/buttons/1.5.3/ until I got a 404 error, then incremented the middle variable and started over)

how to add processing icon for datatable create button

$
0
0


while creating new entry on the in edit datatable when click on create button how to change that button into a processing icon on create button


Advice for performance on exports?

$
0
0

I'm having considerable issues with exports on datatables. It's fairly quick below 1000, going up to around 10 seconds on 2000 records. If I go over 3000 records, it takes over 60 seconds to process and download, over 5000 is go and make coffee. This occurs irrespective of Excel, CSV, PDF or Print buttons, they all perform similar.

For the amount of data, I'm exporting only specific columns, a mix of visible and hidden ones. There's a total of 36 columns. An excel export of 3700 records results in a 5.5Mb file.

I've tried some googling and searching here but I haven't really found anything applicable other than a possible issues with exports beyond 10.1.16 and a reference to FileSaver.js which isn't part of any downloads for DataTables/Editor and I assume is built-in. I use the combined download format as well.

Are there any best practices for configuring exports? I'm not really doing anything complex with my button config, merely specifying columns.

{
                text: 'Excel',
                extend: 'excelHtml5',
                exportOptions: {
                    columns: [1,3,4,5,6,7,8,9,10,11,12,13,14,15,16,17,18,19,20,21,22,23,24,25,26,27,28,29,30,31,32,33,34,35,36,37],
                    modifier: {
                        page: 'current'
                    }
                },
                title: function() {
                    return getLocationName();
                },
                filename: function() {
                    return getLocationName();
                }
            }

Uncaught TypeError: Cannot read property 'i18n' of null

$
0
0

Hi,

When I load the "Buttons" extension ("vendor/DataTables/Buttons-1.5.2/js/dataTables.buttons.js") I get the following error:

Uncaught TypeError: Cannot read property 'i18n' of null
    at text (dataTables.editor.js:7401)
    at text (dataTables.buttons.js:523)
    at Buttons._buildButton (dataTables.buttons.js:583)
    at Buttons._expandButton (dataTables.buttons.js:475)
    at Buttons.add (dataTables.buttons.js:160)
    at Buttons._constructor (dataTables.buttons.js:379)
    at new Buttons (dataTables.buttons.js:85)
    at Object.fnInit (dataTables.buttons.js:1893)
    at _fnAddOptionsHtml (jquery.dataTables.js:3681)
    at _fnInitialise (jquery.dataTables.js:4703)

I have used the "Download" facility to download all the scripts, and have used the suggested code to load the CSS and JS. I am avoiding the CDN approach because my internet connection is dodgy. (Hello from Africa!)

I have pasted the relevant code here: https://pastebin.com/1Dg24zTj

add processing icon for button

$
0
0

when we click create button how to show processing icon there

colvis dropdown active is too blue on Bootstrap4

$
0
0

active should maybe look different? maybe bold the name instead, or add a UTF8 checkmark?

Enable button only if row is selected and a column has a defined value

$
0
0

Hello,
i'm using datatables editor with the buttons 'new', 'edit' and 'delete'. The button 'new' is enabled all the time and the buttons 'edit' and 'delete' are only enabled if a row is selected. This all works fine.

My problem:
I have the column 'active' in my table. It contains the value 0 or 1, which represent the status 'not active' and 'active'. Now i want to extend the function of the 'delete'-button, that it will only be enable if a row is selected AND the value in the column 'active' is 0. If the 'active'-value is 1, the 'delete'-button can't be enabled.
How can i do this?

Thanks a lot for your help.

Viewing all 478 articles
Browse latest View live


<script src="https://jsc.adskeeper.com/r/s/rssing.com.1596347.js" async> </script>